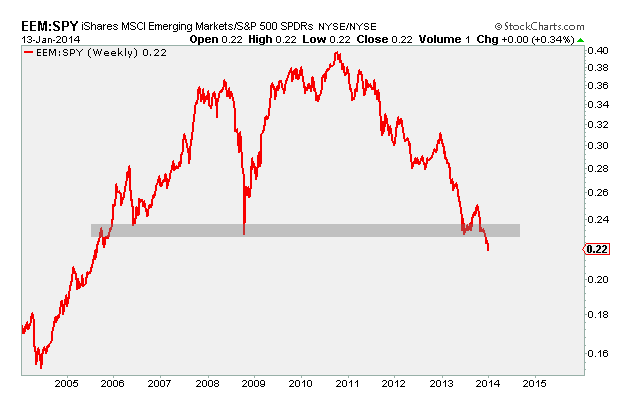
So the question becomes, Would we rather be in US Stocks? or in Emerging Markets? Here is a weekly chart of this ratio currently hitting lows not seen since 2005. You want to talk about downtrends? This is one of the most powerful ones out there. I see no reason to be long this chart unless we can miraculously get back above those 8 years of broken support:
 The next chart is a daily line chart of the same ratio ($EEM vs $SPY) but with RSI plotted below to get a better idea of how short-term momentum might affect price:
 In the very short-term, we do see a possibility of a squeeze based on this potential bullish divergence in momentum. Notice the higher lows RSI is trying to put in as price continues to fall. The last couple of times we’ve see this has led to a nice little rally in the ratio (note: all just temporary). But truthfully, this isn’t anything I’d be interested in on the long side unless we can break back above that shaded area.
This downtrend is in full force. It’s not something I want to fight. So at least for now, we want to continue to look at US Stocks as the leaders over emerging markets. And let’s remember that Emerging markets consist of a wide range of countries and they’re not all created equally. But this is a very diversified ETF with its largest component (Samsung) representing less than 4% of the fund and most of the others are less than 1-2%.
We’ll be watching this one throughout the year. But coming into 2014, the US is still in control.
Please share this article

No comments:
Post a Comment