Today we’re looking at a monthly bar chart of the Dow Jones Industrial Average. By connecting the peaks from the January 2000 highs and October 2007 highs, you can extend that trendline to where we peaked on December 31st:
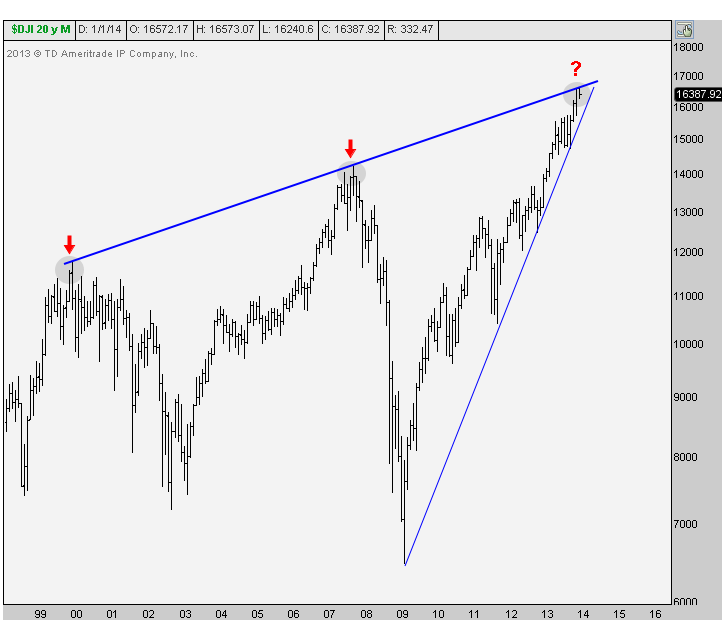
I don’t have a clear answer to this. So I look at other averages like the Nasdaq100 and Russell2000 and they’re making new all-time highs. So what’s up with the Dow? For the most part, these guys all trade together, and any short-term divergences usually even themselves out over time. So who’s right? Nasdaq and Russell or papa Dow?
Do you guys use trendlines to connect peaks in uptrends, not just the troughs?
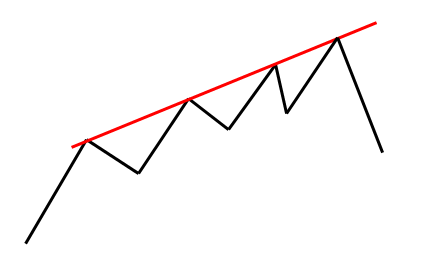 Personally, I do use trendlines to connect peaks in uptrends. And I take them more seriously than connecting troughs in downtrends. That can be a death sentence depending on the name (i.e $BSC $LEH etc). If something is crashing that bad, you are taking serious overnight gap risk, and that’s too much for me. Peaks in uptrends are a different story.
So me? Yes I think this trendline matters.
Do you?
Please share this article
No comments:
Post a Comment